Analysis
Analysis represents a collection of STOmics data. It should contain spatial positions, gene expression matrices, visualized images, cell annotation, etc.
Spatial Positions
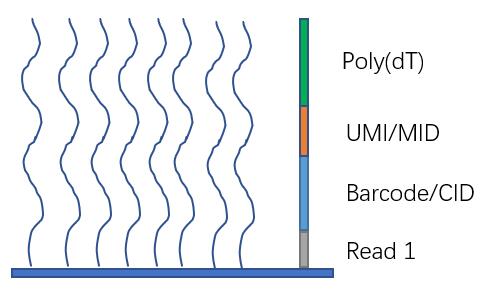
Spatial coordinate index data, contains Spatial Barcode/Coordinate Identity (CID) and it’s position coordinate.
Gene Expression Information
Gene expression information is usually given in the form of matrix, which records the number of UMIs/MIDs associated with a feature and a barcode/CID.
Visualization Images
There are a series of images for tissue detection, for example,
brightfield or fluorescence images acquired by imaging system,
registered microscopic image,
downsampled versions of the original, full-resolution image.
Cell Annotation
Cell idetification and segmentation performed to define each cell population based on marker genes, cell morphology, etc.
Other Downstream Analysis Data
Data sets generated by downstream analysis such as maker identification, cluster annotation, differential expression, etc. Scripts are also included.